
A sustainable data center draws its power from sources that put out less carbon dioxide and local air pollution, and use less water, for each megawatt-hour. No technology earns that by name. A gas engine, a turbine or a fuel cell can raise or lower a site's footprint, depending on its heat rate, its fuel and the grid it displaces.
The practical test is arithmetic. Fuel burned per MWh, times EPA's emission factor for that fuel, gives on-site CO2 per MWh. Set that against the local grid's rate from EPA's eGRID, then add NOx controls, water and fuel options. The on-site prime movers below sit in SecondWatt's gas turbine, gas engine and fuel cell pages.
Key Takeaways
- On-site CO2 follows heat rate. An HHV heat rate in MMBtu/MWh times EPA's 53.06 kg CO2/MMBtu for natural gas gives kg/MWh; LHV rates first rise 10.75%.
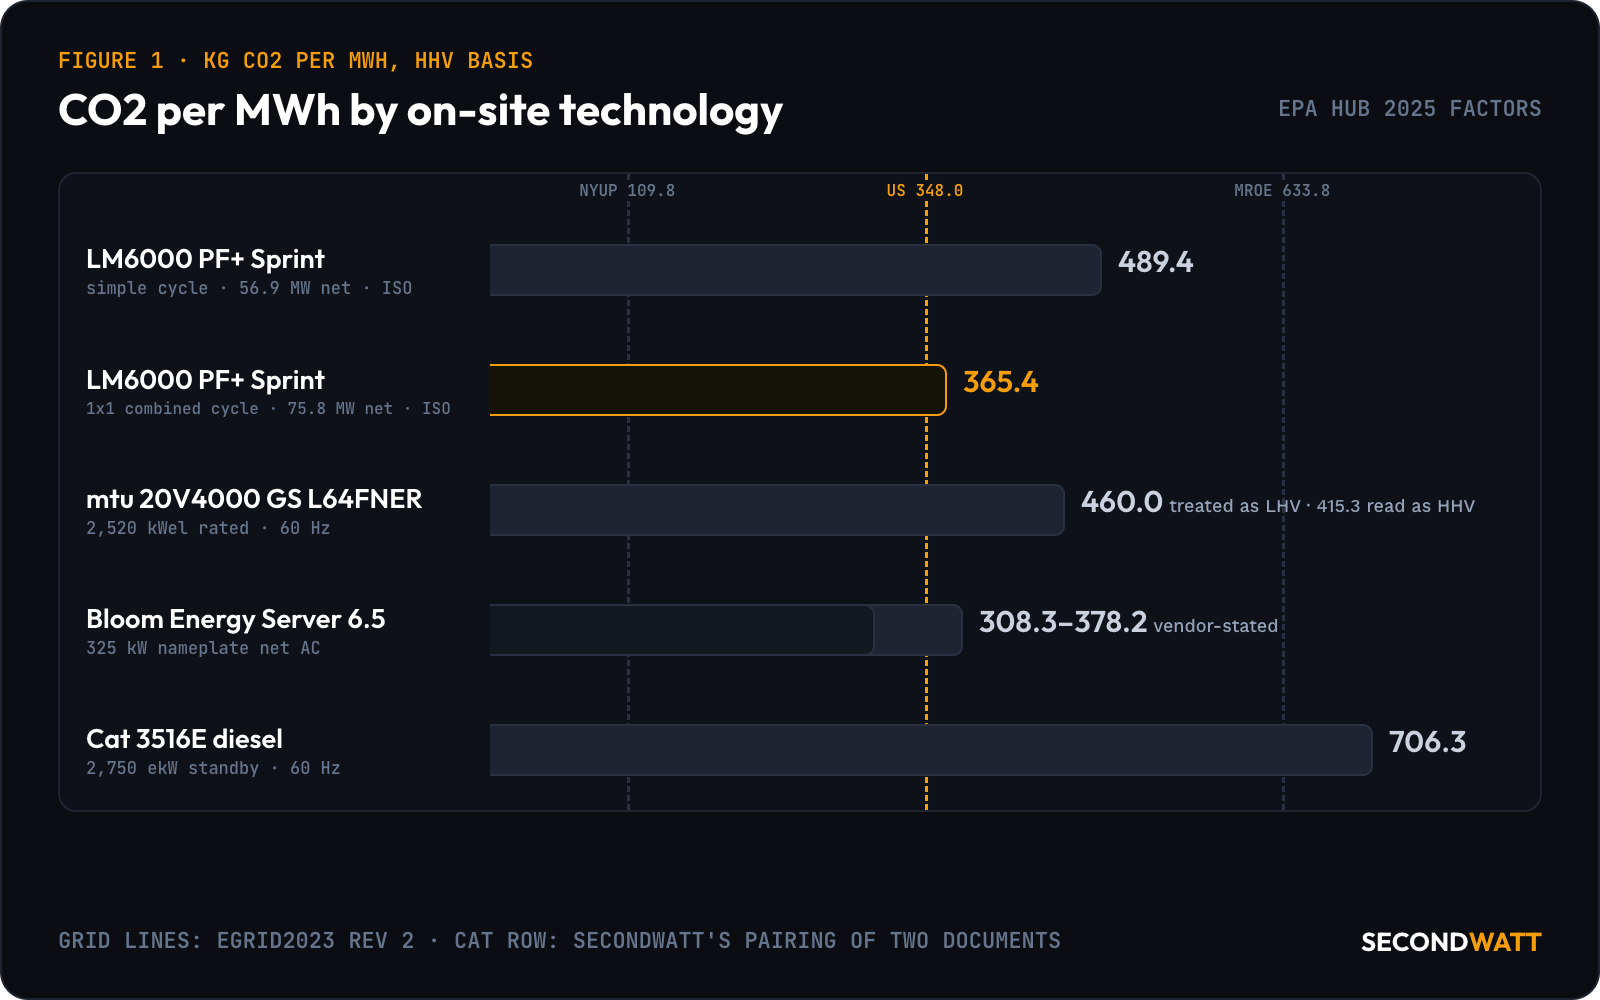
- The combined-cycle row emits about a quarter less CO2. The LM6000 PF+ Sprint works out at 365.4 kg/MWh in 1x1 combined cycle and 489.4 in simple cycle, both at ISO.
- The grid baseline depends on the subregion. EPA's eGRID puts the 2023 US average at 767.2 lb CO2/MWh, with subregions from 242.1 to 1,543.1 lb.
- Most on-site gas rows emit more than the US grid average. Only Bloom's vendor-stated low end falls below 348.0 kg/MWh; in MRO East, at 633.8, every gas row is lower.
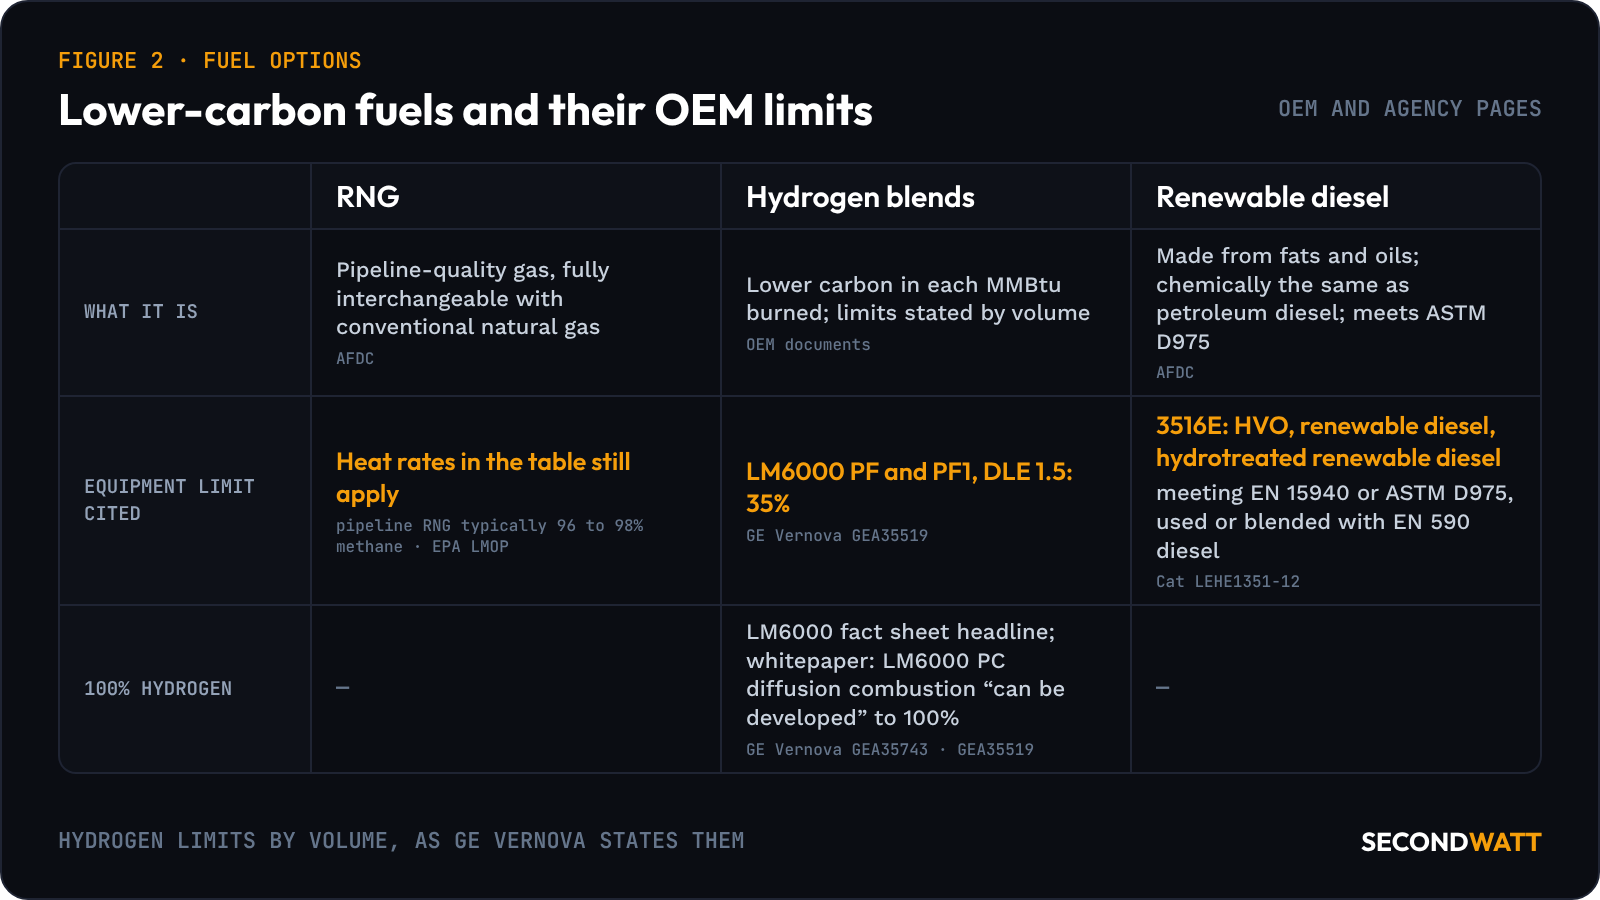
- Lower-carbon fuels come with OEM limits. The LM6000 PF's DLE 1.5 combustor is capable of 35% hydrogen blends by volume; the 3516E sheet lists HVO and renewable diesel.
How to measure a sustainable data center's power#
Four measures carry most of the answer: CO2 per MWh, local pollutants such as NOx, water used per MWh, and where the fuel comes from. A technology label settles none of them. A combined-cycle plant and a simple-cycle turbine burn the same gas at very different rates per MWh.
Chapter 4 of the GHG Protocol Corporate Standard, Revised Edition draws the line between on-site and purchased power. Direct emissions "occur from sources that are owned or controlled by the company," such as combustion in owned or controlled boilers and furnaces, and fall in Scope 1. Scope 2 covers emissions from the generation of purchased electricity the company consumes. On-site generation the company owns or controls moves a site's power emissions from Scope 2 into Scope 1, whether they rise or fall.
The Power Intelligence Tool ranks power generation technologies against project priorities, emissions among them. The sections below give the inputs behind an emissions comparison, so a team can work one by hand.
CO2 per MWh by on-site technology#
Each row below starts from an OEM heat rate or fuel rate and ends in kilograms of CO2 per MWh. The emission factors come from Table 1 of the 2025 edition of EPA's Emission Factors Hub. They are "per unit of heat content using higher heating values (HHV)," and they count combustion emissions only, not upstream emissions.
Turbine and engine heat rates sit on the other basis. Footnote 43 of EPA's September 2017 Catalog of CHP Technologies says, "All turbine and engine manufacturers quote heat rates in terms of the lower heating value (LHV) of the fuel." Natural gas averages 1,030 Btu/scf on an HHV basis and 930 Btu/scf on an LHV basis, a ratio the catalog rounds to about 0.9 (LHV/HHV) in footnote 16. Every row quoted on LHV uses that pair: 1,030 ÷ 930 = 1.10753.
SecondWatt calculation: CO2 per MWh from OEM heat rates and EPA Emission Factors Hub (2025) factors, HHV basis (OEM sheets as dated in the text)#
| Technology (model) | OEM heat rate or fuel rate (basis) | HHV heat rate (Btu/kWh) | EPA factor (kg CO2/MMBtu, HHV) | kg CO2/MWh |
|---|---|---|---|---|
| GE Vernova LM6000 PF+ Sprint, simple cycle, 56.9 MW net, ISO, 50/60 Hz | 8,328 Btu/kWh, LHV, net | 9,223.5 | 53.06 (natural gas) | 489.4 |
| GE Vernova LM6000 PF+ Sprint, 1x1 combined cycle, 75.8 MW net, ISO, 50/60 Hz | 6,218 Btu/kWh, LHV, net | 6,886.6 | 53.06 (natural gas) | 365.4 |
| mtu 20V4000 GS L64FNER, 2,520 kWel rated, 60 Hz | 5,781 kW energy input per 2,520 kWel rated output = 7,827.6 Btu/kWh, basis not stated (treated as LHV) | 8,669.3 | 53.06 (natural gas) | 460.0 |
| Bloom Energy Server 6.5, 325 kW nameplate net AC, 50/60 Hz (vendor-stated) | 5,811–7,127 Btu/kWh, HHV | 5,811–7,127 | 53.06 (natural gas) | 308.3–378.2 |
| Cat 3516E, 2,750 ekW standby, 60 Hz | 720.4 L/h at 100% load with fan | 9,550 | 73.96 (distillate fuel oil No. 2) | 706.3 |
Worked example, the LM6000 row. The PF+ Sprint's simple-cycle net heat rate is 8,328 Btu/kWh (LHV) in GE Vernova's September 2025 fact sheet. That rating is at ISO conditions on natural gas, with inlet and exhaust losses included and balance of plant equipment excluded. The conversion runs:
8,328 × 1.10753 = 9,223.5 Btu/kWh (HHV) = 9.2235 MMBtu/MWh; 9.2235 × 53.06 = 489.4 kg CO2/MWh.
The combined-cycle row comes from the same fact sheet and basis note: the PF+ Sprint in a 1x1 combined cycle is rated 75.8 MW net at 6,218 Btu/kWh (LHV). It converts the same way: 6,218 × 1.10753 = 6,886.6 Btu/kWh (HHV), and 6.8866 × 53.06 = 365.4 kg CO2/MWh.
The mtu row divides energy input by electrical output on mtu's Series 4000 natural gas sheet for 480 V/60 Hz, number 3237291, Edition 01/24. The sheet rates output at power factor 1.0 and gives performance data under ISO 3046/I-2002 with 5% tolerance. It names no heating-value basis, so the row treats it as LHV on the catalog statement above. Read as HHV, the same sheet gives about 415.3 kg CO2/MWh.
The diesel row needs no LHV step, because EPA gives distillate's heat content per gallon on the HHV basis. Caterpillar's spec sheet LEHE1351-12, dated 08/26, has the 3516E burning 720.4 L/h at its 2,750 ekW standby rating. That is 720.4 ÷ 3.785411784 = 190.31 gal/h. At 0.138 MMBtu per gallon, the set burns 26.263 MMBtu/h, or 9.550 MMBtu per MWh, and 9.550 × 73.96 = 706.3 kg CO2/MWh.
Both Cat inputs sit in the sheet's standby column, with fan: 720.4 L/h at 100% load and the 2,750 ekW genset rating. The sheet reports fuel under ISO 3046-1, on a reference oil with an LHV of 42,780 kJ/kg at 850 g/L. On that oil, 720.4 × 0.850 × 42,780 = 26,196 MJ/h, or 24.83 MMBtu/h on LHV. EPA's HHV default of 0.138 MMBtu per gallon sits 5.8% above that oil's 0.13047 on LHV, so the row's 9,550 Btu/kWh is SecondWatt's pairing of the two documents.
The bases differ, and the table keeps them visible. The two turbine rows are net plant ratings on one GE Vernova basis note, and the Bloom row is net AC. The mtu row is rated electrical output at power factor 1.0, and the Cat row is the genset rating with fan.
On these inputs, the combined cycle emits about 25% less CO2 per MWh than the same turbine in simple cycle: 365.4 ÷ 489.4 = 0.7466. The heat rate guide and the simple-cycle vs combined-cycle comparison cover the cycle choice.
For a buyer comparing quoted units, the mtu row shows what one missing label is worth: 460.0 against 415.3 kg/MWh, a 44.7 kg gap. Each quoted heat rate needs its heating-value basis, its rating conditions and whether the output is net or gross.
Grid power as the baseline#
Grid power sets the baseline, and EPA's eGRID publishes it for the US and each subregion. The 2023 US total output emission rate was 767.2 lb of CO2 per MWh, or about 348.0 kg/MWh at 0.45359237 kg per lb. That figure is in Table 1 of the eGRID 2023 Summary Tables, revision 2, from data released in January 2025 and revised on 12 June 2025.
767.2 lb CO2/MWh — the US average total output emission rate for 2023 in EPA's eGRID summary tables (revision 2), about 348.0 kg per MWh.
The subregions spread widely. Upstate New York (NYUP) reads 242.1 lb/MWh, about 109.8 kg. Puerto Rico Miscellaneous (PRMS) reads 1,543.1 lb, about 699.9 kg, so the highest rate is 6.37 times the lowest.
In the contiguous US, MRO East (MROE) is highest at 1,397.3 lb, about 633.8 kg. ERCOT (ERCT) sits near the average at 733.9 lb, about 332.9 kg, and WECC California (CAMX) reads 428.5 lb. Each figure is CO2 per MWh generated in that subregion.
Table 6 of the Hub's 2025 edition still prints the January 2025 eGRID2023 values, with 771.5 lb/MWh for the US average; the revision-2 summary tables are the later reading. Table 6 also gives each subregion's grid gross loss, 4.2% for the US average, which the Hub says can be used to calculate Scope 3 transmission and distribution losses.
Data center emissions on grid power depend on the subregion, so the same on-site plant can raise one site's footprint and lower another's. Against the US average, every on-site row is higher except the fuel cell's low end; the combined-cycle row, the lowest turbine row, is 5.0% above it. In Upstate New York every row emits more than the grid, and in MRO East every gas row emits less. In ERCOT, only the fuel cell's low end beats the grid.
Local air emissions and their controls#
CO2 is a global measure; NOx, CO and particulates are local ones, and the air permit governs them. Each OEM states them on its own basis, so the figures below cannot be ranked against one another.
GE Vernova's LM6000 page offers the LM6000VELOX package with either a dry low emission (DLE) combustor or a water-injected single annular combustor (SAC). The legacy aeroderivative DLE combustor reaches NOx "as low as 15 ppm without water/steam injection or post treatment," GE Vernova says in a March 2026 whitepaper. The mtu sheet in the table is the version for NOx below 500 mg/Nm3.
Exhaust catalysts do the rest. On reciprocating engines, selective catalytic reduction (SCR) reduces NOx to nitrogen using ammonia or urea, with 80 to 90% reductions achievable, and oxidation catalysts can reach 95% conversion of CO and non-methane hydrocarbons. Many gas turbines in locales with stringent emission rules also use SCR, according to sections 1.3 and 2.5.2 of EPA's CHP catalog. The gas turbine permitting guide covers air permits for turbines at data center sites.
Diesel standby sits under its own rules. The 3516E is EPA-certified for emergency stationary applications at Tier 2, per Caterpillar's sheet; the Tier 4 Final guide explains the stricter tier. The Energy Server 6.5 fuel cell emits 0.003 lb/MWh of NOx and 0.013 lb/MWh of CO, by the vendor's own figures. They come from Bloom's Energy Server 6.5 data sheet, document 1016932-20260204.
Water#
Water use differs most where a steam cycle needs cooling. In a Texas study EPA cites, a natural gas combined-cycle plant consumes 180 gal/MWh with closed-loop cooling towers and an estimated 60 (±10) with air cooling. Combustion turbines use negligible amounts, according to Table 1-4 of the EPA Catalog of CHP Technologies. CHP systems built on reciprocating engines, combustion turbines, microturbines and fuel cells "use almost negligible amounts of water," in the same catalog's words.
180 gal/MWh — the water a natural gas combined-cycle plant consumes with closed-loop cooling towers, in the Texas study behind the CHP Catalog's Table 1-4.
Ansaldo's AE64.3A page says the AE64.3A gas turbine burns its fuels in dry premix mode with no water consumption. That statement covers combustion; the combined-cycle water figures above come from steam-cycle cooling. The Sprint option on the LM6000 does inject atomized water to cool compressor air, and Bloom lists no water use in normal operation. The gas turbine water guide has the turbine detail.
Fuel options: RNG, hydrogen blends and renewable diesel#
Renewable natural gas changes the fuel's source rather than the machine. The Alternative Fuels Data Center's renewable natural gas page describes RNG as "a pipeline-quality gas that is fully interchangeable with conventional natural gas," made from biogas processed to purity standards. Because it is interchangeable, the heat rates in the table still apply.
Hydrogen blends lower the carbon in each MMBtu burned, within OEM limits stated by volume. GE Vernova's whitepaper says the DLE 1.5 combustor in LM6000 PF and PF1 turbines "is currently capable of combustion of 35% (by volume) H2 and natural gas blends."
The LM6000 fact sheet headlines "Up to 100% Hydrogen (H2) Capability", and the whitepaper sets that limit by model. The LM6000 PC's diffusion combustion "can be developed to combust up to 100% H2", while the DLE-based LM6000 PF/PF+ "can burn up to 35% (by volume) H2".
For diesel standby sets, the fuel option is renewable diesel. The Alternative Fuels Data Center's renewable diesel page says it is made from fats and oils, processed to be chemically the same as petroleum diesel, and meets ASTM D975. For the 3516E, Caterpillar's sheet lists HVO, renewable diesel and hydrotreated renewable diesel as certified alternative fuels. Those that meet EN 15940 or ASTM D975 "can be used or blended with EN 590 diesel," in the sheet's words.
Solar, storage and combined heat and power#
Solar burns no fuel at the site, so its combustion CO2 is zero. Its limit is output over time. According to EIA's Electric Power Monthly, US utility-scale solar photovoltaic plants had a 24.0% capacity factor in 2025, from 13.1% in December to 31.9% in June and July. The figures are from Table 6.07.B of the edition released 23 Oct 2026, with data for August 2026.
That gap sets the size of a solar-plus-storage plan for a 24/7 load. On energy alone, at 2025's national capacity factor, 1 ÷ 0.240 = 4.17 MW of solar capacity matches one MW of constant load across the year. Storage then has to carry the night and the cloudy weeks, and its losses and the winter months add more. The battery storage guide shows how MW and MWh are sized, and SecondWatt's battery pages list the systems.
Combined heat and power puts the exhaust heat to use. Section 1 of EPA's CHP catalog says a facility then reaches the same output "with lower levels of fossil fuel combustion and reduced emissions of carbon dioxide." The Energy Server 6.5 lists a cumulative thermal efficiency above 36%, with exhaust heat at more than 350 °C, and a total efficiency above 90%, all vendor-stated. The combined heat and power guide covers CHP at data centers.
FAQ: sustainable data center power#
What is the most sustainable way to power a data center?#
On carbon, the option whose CO2 per MWh sits furthest below the eGRID rate where the site connects, over the hours it actually runs. No row in the table beats the grid in every subregion, because the grid it displaces changes from one to the next.
Duty changes the total. The 3516E's standby rating assumes typical operation of 200 hours per year, with maximum expected usage of 500. Even if all 200 typical hours ran at the full 2,750 ekW, one set would generate 2.75 × 200 = 550 MWh, about 388.5 t of CO2 at 706.3 kg/MWh. A behind-the-meter plan should state which comparison it makes, and over how many hours.
Are fuel cells cleaner than gas turbines?#
On CO2, the Energy Server 6.5 beats the simple-cycle row across its whole range and the combined cycle only at its efficient end. Its vendor-stated 308–378 kg/MWh sits below the LM6000's 489.4 and brackets its combined-cycle 365.4.
The two sides of that comparison share a heating-value basis. Bloom's 65% LHV efficiency gives 3,412.14 ÷ 0.65 = 5,249.4 Btu/kWh on LHV, and its 5,811 Btu/kWh HHV heat rate is 1.1070 times that, close to the catalog pair's 1.10753. The fuel cell benchmark article compares time to power.
Can gas turbines run on hydrogen?#
Some run on blends today. At the New York Power Authority's Brentwood station, an LM6000 PC in simple cycle, with a water-injected SAC combustor and SCR, ran on 5% to 44% hydrogen by volume. According to GE Vernova's whitepaper, CO2 mass emission rates fell about 14% at 35% hydrogen by volume, while turbine NOx rose by up to 24% as the hydrogen fraction increased. Hydrogen carries lower energy per unit volume than methane, so a blend cuts CO2 by less than its volume share.
What is renewable natural gas?#
RNG is biogas "that has been upgraded for use in place of fossil natural gas," in the description EPA's voluntary programs use on the Landfill Methane Outreach Program's RNG page. Raw biogas holds 45 to 65% methane. Upgraded gas holds 90% or more, and RNG injected into a pipeline typically 96 to 98%. RNG has no standard definition at present; EPA calls it a "term of art".
Do on-site generator emissions count as Scope 1?#
Yes, when the company owns or controls the generator. Emissions that result from the company's activities but occur at sources owned or controlled by another company are indirect, and electricity "purchased or otherwise brought into the organizational boundary" falls in Scope 2. Whether an emission counts as direct or indirect depends on the consolidation approach the company selects, equity share or control. Direct CO2 from burning biomass stays out of Scope 1 and is reported separately.
Sourcing lower-emission power equipment#
SecondWatt publishes equipment research and helps buyers source power equipment; it earns a fee when a sale it arranges closes. If you are buying, send a request that names the site's eGRID subregion, air-permit limits and fuel, and asks for each heat rate with its heating-value basis. If you own turbines, engines or fuel cells leaving service, start at the seller page.